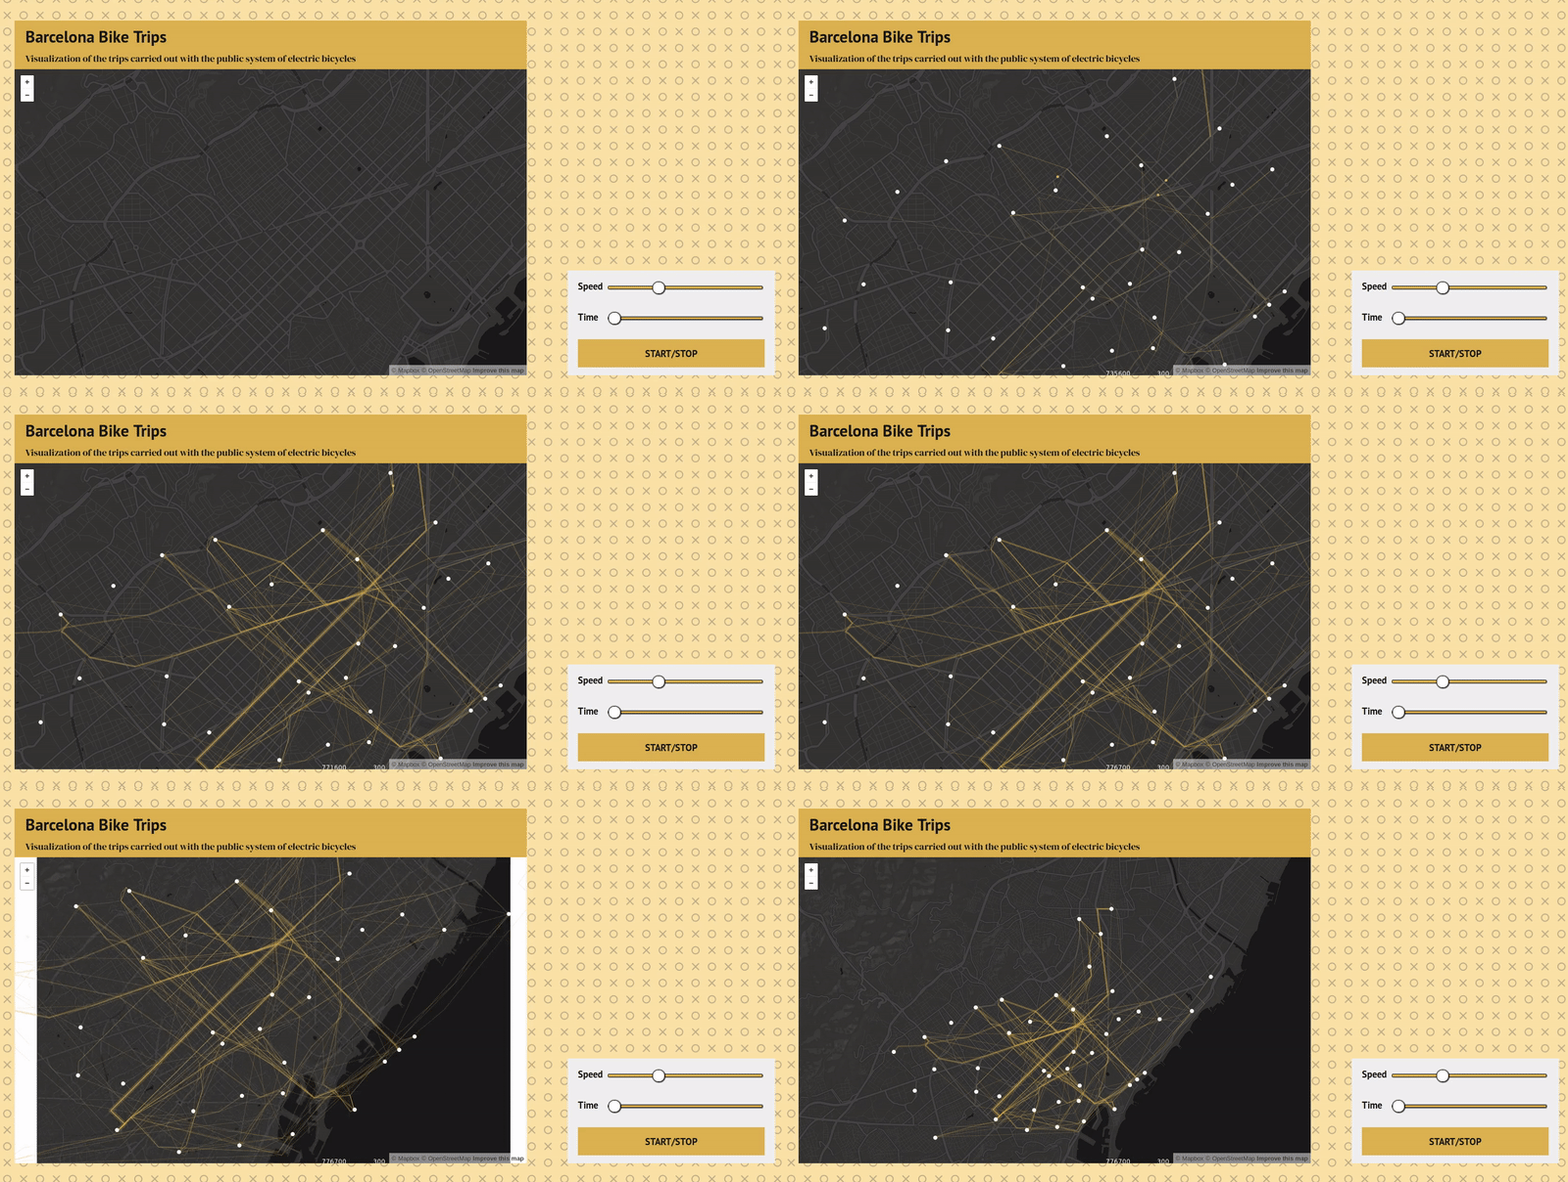
Visualization of the trips carried out with the public system of electric bicycles of the city of Barcelona. This repo is based on the data generated on the imartinezl/bicing-analysis repo, which estimates bicycle trips based on the state of each station over time. As a first version of the visualization, this project explores the limits of canvas-based libraries, such as p5.js and mappa.js.

Date |
Jul 2019
Technologies |
html
·
css
·
js
·
gulp
·
sass
·
browserify
·
nodejs
·
p5
·
mappa
·