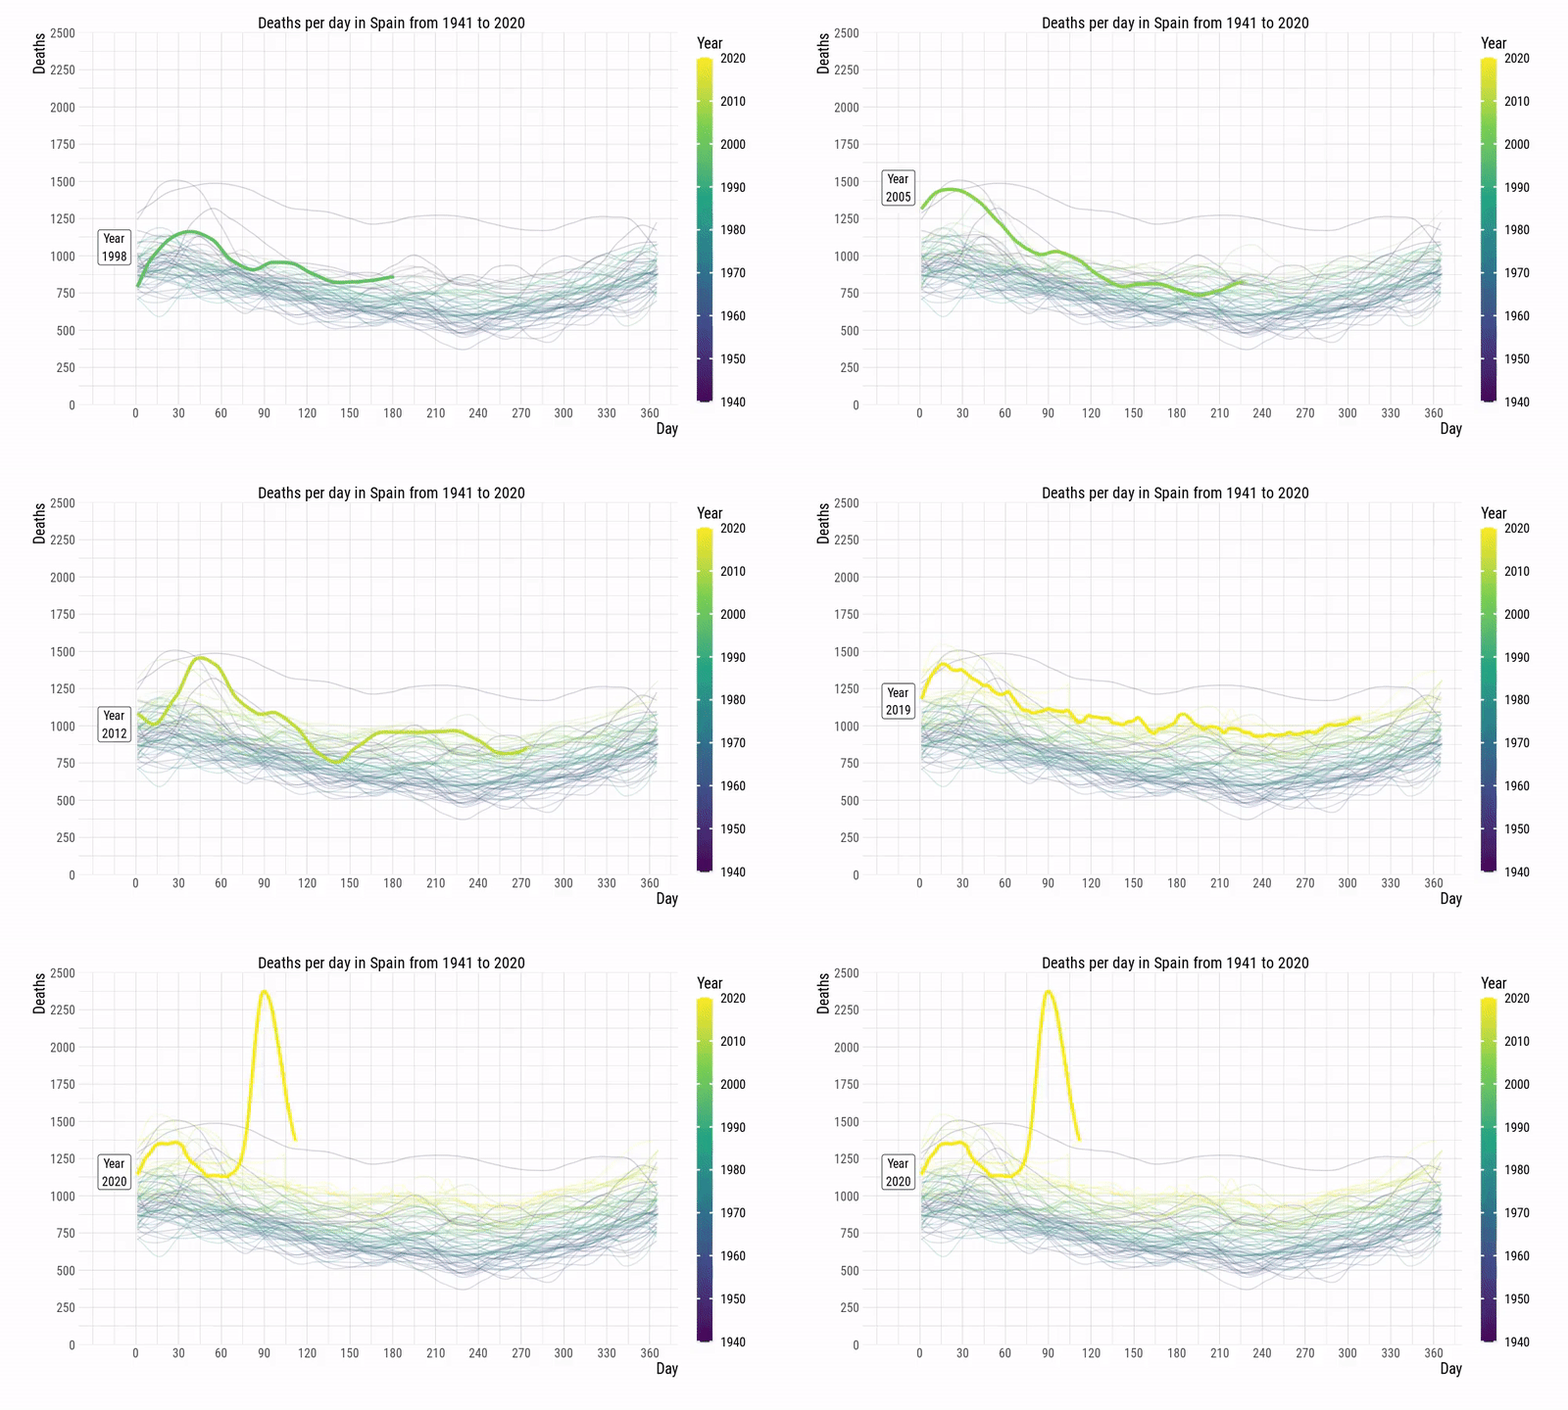
Visualization of mortality index in Spain from 1941 to 2020.
Data was obtained by joining three separate CSVs from Momo and INE. The frequency of data increases from April 2018 until now. Due to this fact, there is a small jump in the 2018 series.
Apart from the obvious COVID19 peak on March and April 2020, little is known about the intensity of the great subsistence crises of 1941 and 1946, caused by years of poor wheat harvests, in a situation of international isolation. The number of deaths on 1941 are also related to the Spanish civil postwar period.
It is possible to recognize minor crises, such as those of 1951, 1953 and around 1970, which have traditionally been blamed on the epidemic cycle of the flu, although these episodes are also correlated with significant political and economic circumstances. Finally, Spanish growing population (from 30 million in 1960 to 46 million in 2010) can explain the noticeable increase in the number of deaths during that period.
