Analysis of the population density in Europe and in Spain. It covers the entire data ETL pipeline: data extraction from european and spanish public institutions, data transformation and analysis, and a visualization stage. Please, notice that the used datasets are quite large in size, and thus the project has been concieved from an educational point of view, always looking for the maximum efficiency in the entire pipeline.
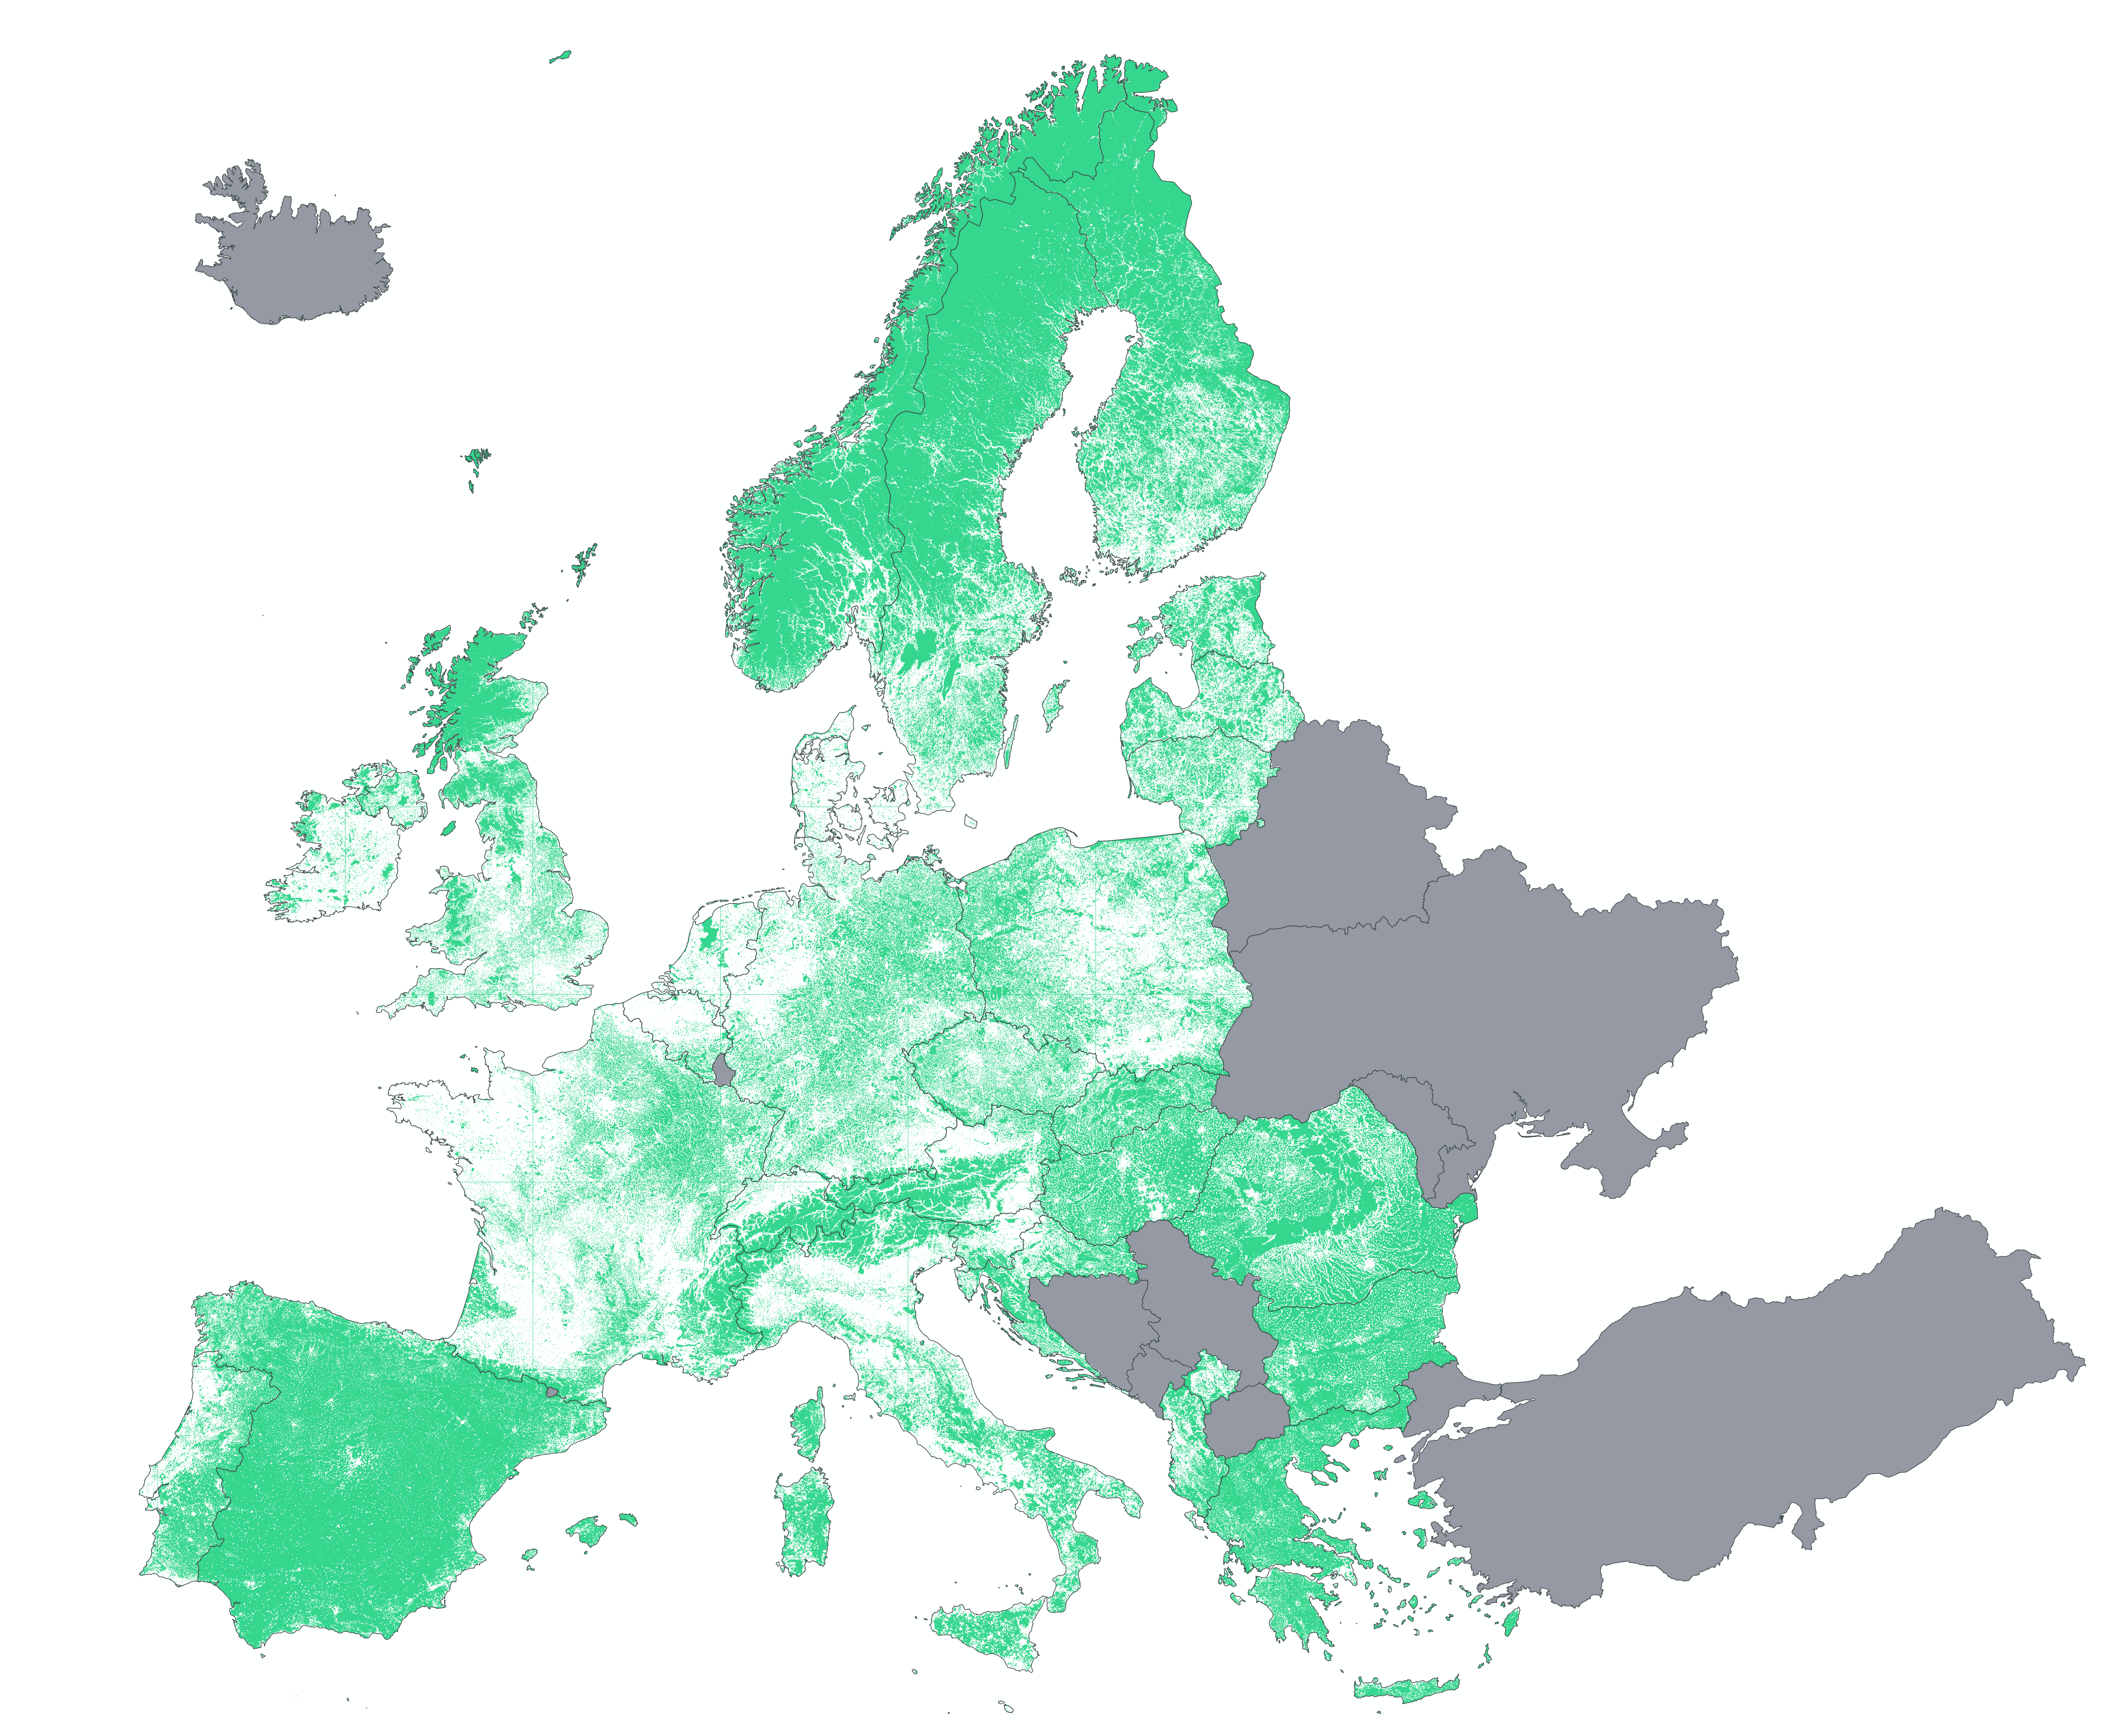
Visualize the least populated regions in Europe
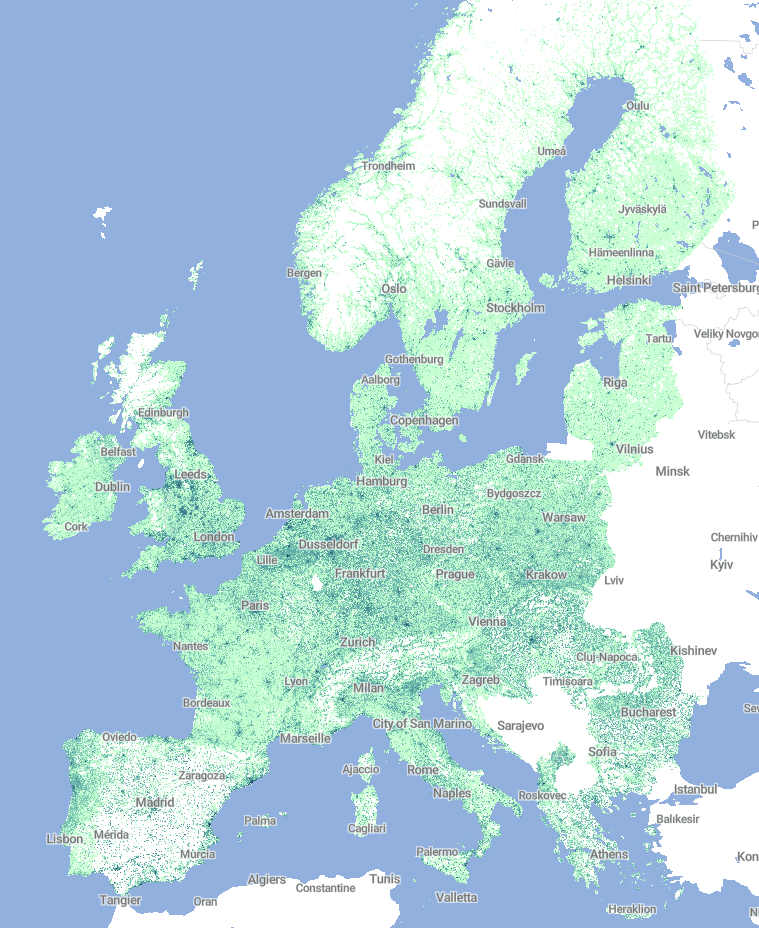
I was very much inspired by this article where John Elledge introduces the visualization of Dan Cookson, a map with the EU Population at 2011 onto a 1km grid. This great visualization is available here.
Learn how to approach the visualization of large spatial datasets
Prior to this project, I had some experience working with small spatial datasets. Therefore, a large dataset presented a nice challenge! The european 1km per 1km square grid dataset comprises over 2.000.000 features that need to be processed and rendered onto the map.
Date |
May 2019
Technologies |
r
·
ggplot2
·
dplyr
·
carto
·
mapbox
·
github
·
mbtiles
·
geojson
·