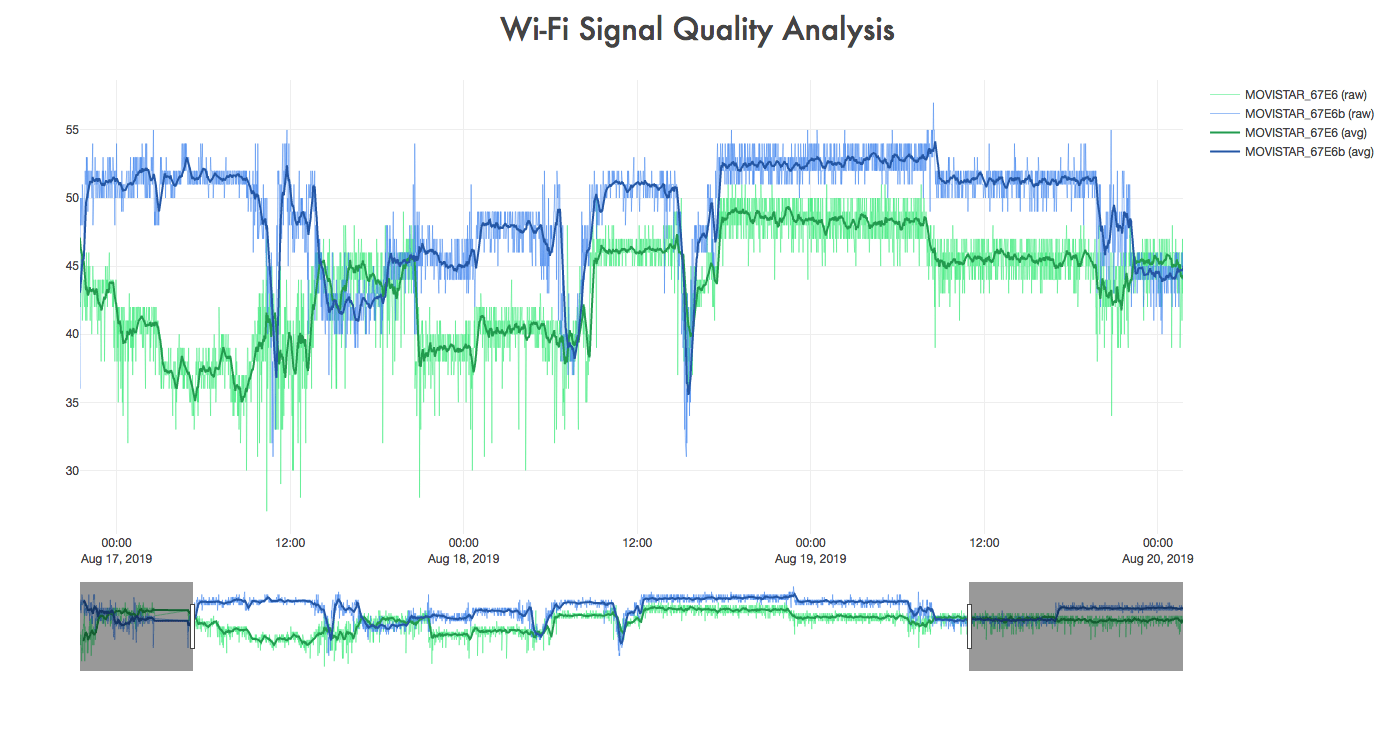
Wi-Fi signal data gathering, analysis and visualization. The main goal of this project is to check the quality signal and coverage of a local Wi-Fi router.
Wi-Fi network analysis
- iwlist: detailed wireless information from a wireless interface
- python-iwlist: python scanner and parser for wireless networks
Connected devices
- nmap: open source utility for network discovery and security auditing
- nmap python: python library which helps in using nmap port scanner
Data exploration
- R - Programming Language / 3.6.0
- RStudio - IDE for R / 1.2.1335
- dplyr - A grammar of data manipulation / 0.8.1
- ggplot2 - Create graphics with R / 3.1.1
- jsonlite - JSON Parser and Generator for R / 1.6
- lubridate - Library for date-times / 1.7.4
Deployment
The python script wifi_analysis2.py was run every minute on a RaspberryPi3B using crontab, a cron (time-based job scheduler) expression editor.
Data visualization
Every minute, requested data was appended to a csv file. In order to visualize this information, a local server was designed using Node.js express server. This server makes a call to request the csv data and builts a plot using Plotly.js